Back in time
Natural disasters since 1960
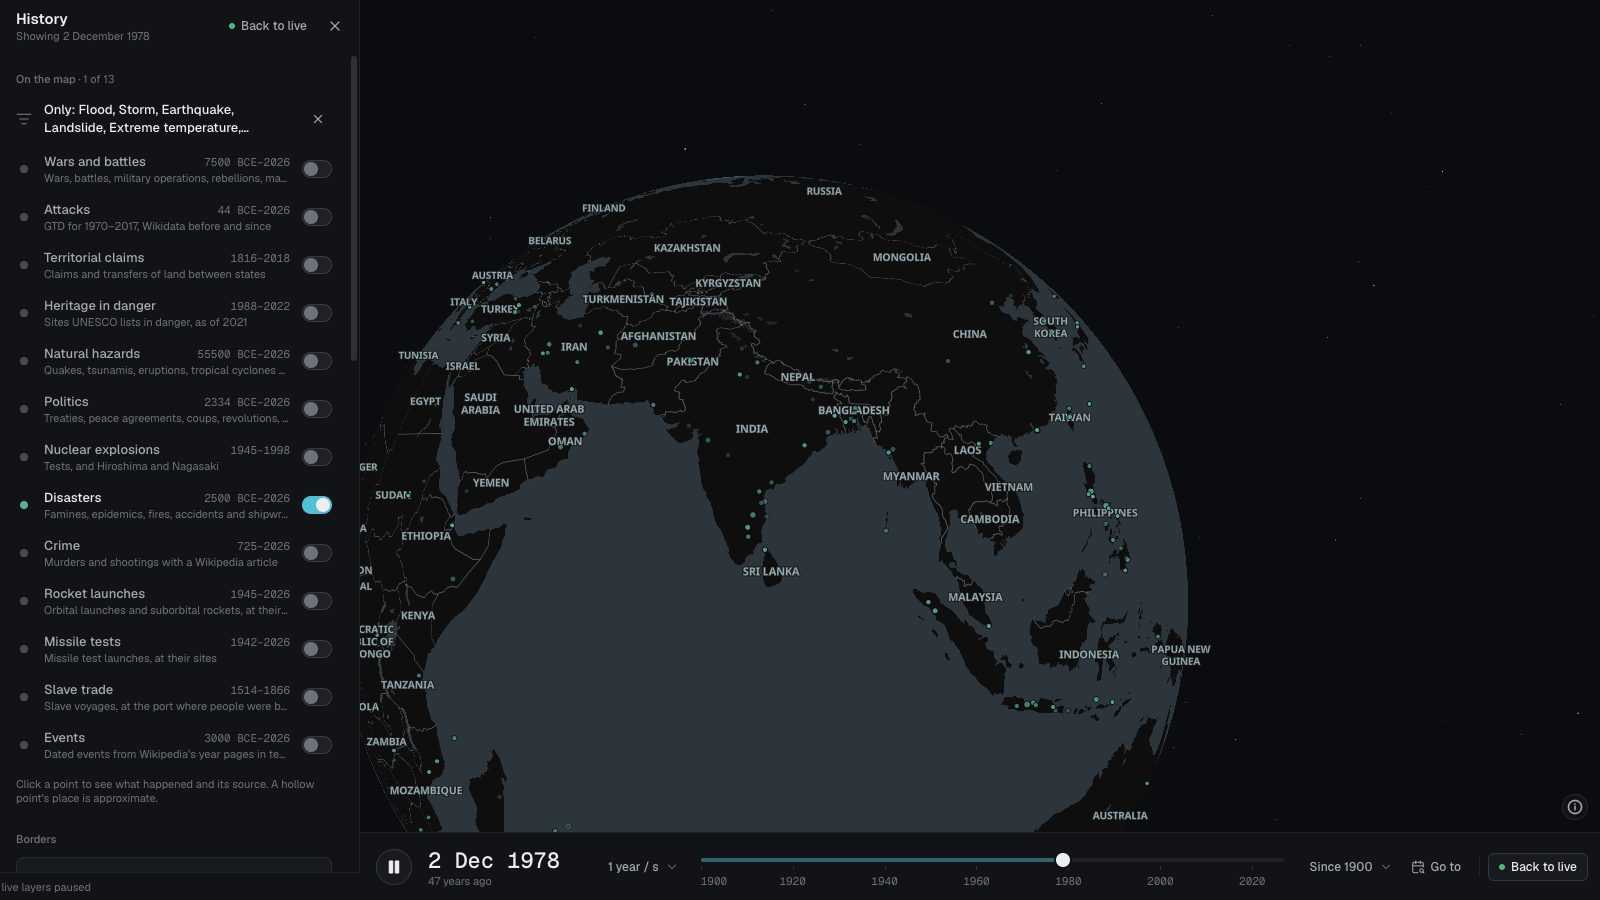
The disasters in EM-DAT, the international disaster database, as the GDIS project geocoded them: about 9,900 floods, storms, earthquakes, landslides, droughts and temperature extremes from 1960 to 2018.
 Open the live map
What you see
- Each disaster as one teal mark at the middle of the places it hit, sized by how many places that was.
- Click one for the provinces or districts it hit.
- Opened from this page, the map shows only these disasters; famines, epidemics, fires, accidents and shipwrecks each have a page of their own.
- Opened from this page, the map plays 1960 to 2018.
Where the data comes from
- GDISGeocoded Disasters 1960–2018 (Rosvold and Buhaug, PRIO, through NASA SEDAC): EM-DAT’s disasters matched to the places they hit.
A published dataset that ends in 2018.
Good to know
- The places hit are provinces or districts, so a disaster is drawn at their middle, not where it began.
- No deaths or damage: GDIS gives the places, and EM-DAT’s figures are not part of it.
- Floods and storms are seven in ten of the events.
- An earthquake can appear twice in History: as NOAA’s quake, and here as the places it hit.
The most places hit
- Drought — India2009 · Drought · Places hit 252
- Storm — United States2003 · Storm · Places hit 133
- Storm — Philippines2010 · Storm · Places hit 108
- Storm — Philippines2009 · Storm · Places hit 83
- Storm — Turkey2004 · Storm · Places hit 80
- Extreme temperature — Turkey2000 · Extreme temperature · Places hit 78
- Flood — New South Wales, Australia2009 · Flood · Places hit 67
- Flood — Algeria2001 · Flood · Places hit 51
- Storm — United States2017 · Storm · Places hit 49
- Storm — United States2002 · Storm · Places hit 48
The first recorded here in each century
- Bei der Cäcilienflut, einer Sturmflut im Bereich der Unterelbe kommen bis zu 30.000 Menschen ums Leben22 Nov 1412 · Flood
- St. Felix's flood devastates Zeeland: a large part of the Verdronken Land van Reimerswaal is lost leading to decline of the city of Reimerswaal5 Nov 1530 · Flood
- London Beer Flood: A large vat full of porter owned by Meux's Brewery of London bursts, demolishing buildings and killing 8 people17 Oct 1814 · Flood
- inondation de la ville de Mamers dans la Sarthe faisant dix-sept morts7 Jun 1904 · Flood
- Boscastle flood of 2004: flash floods destroy buildings and wash cars out to sea in Cornwall16 Aug 2004 · Flood
Goes well with
 Earthquakes in historyAbout 13,800 earthquakes on one map: NOAA’s significant quakes from around 2150 BCE, Europe’s from 1000 to 1899 from EPICA, and USGS quakes since 2026.
 Tropical cyclones since 1842More than 13,000 hurricanes, typhoons and cyclones from 1842 to today from IBTrACS, each drawn along its track, with a dot where its winds peaked.
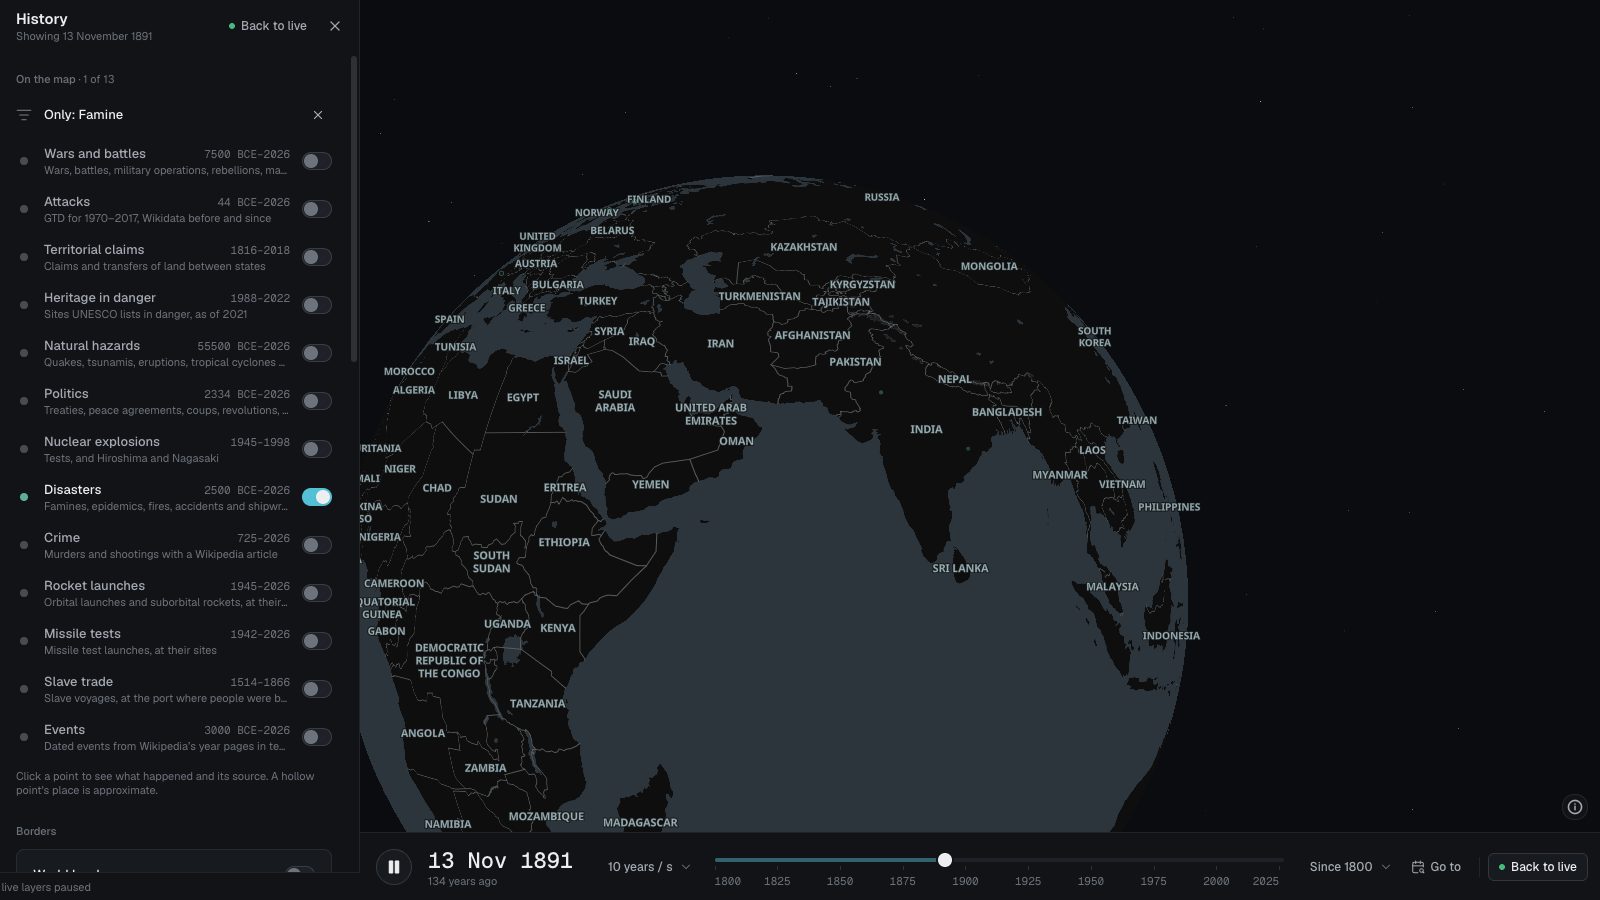 Famines in historyThe famines that have a Wikipedia article, from Japan’s Yōwa famine of 1181 to this decade, on one map: 67 of them, each placed where it struck.
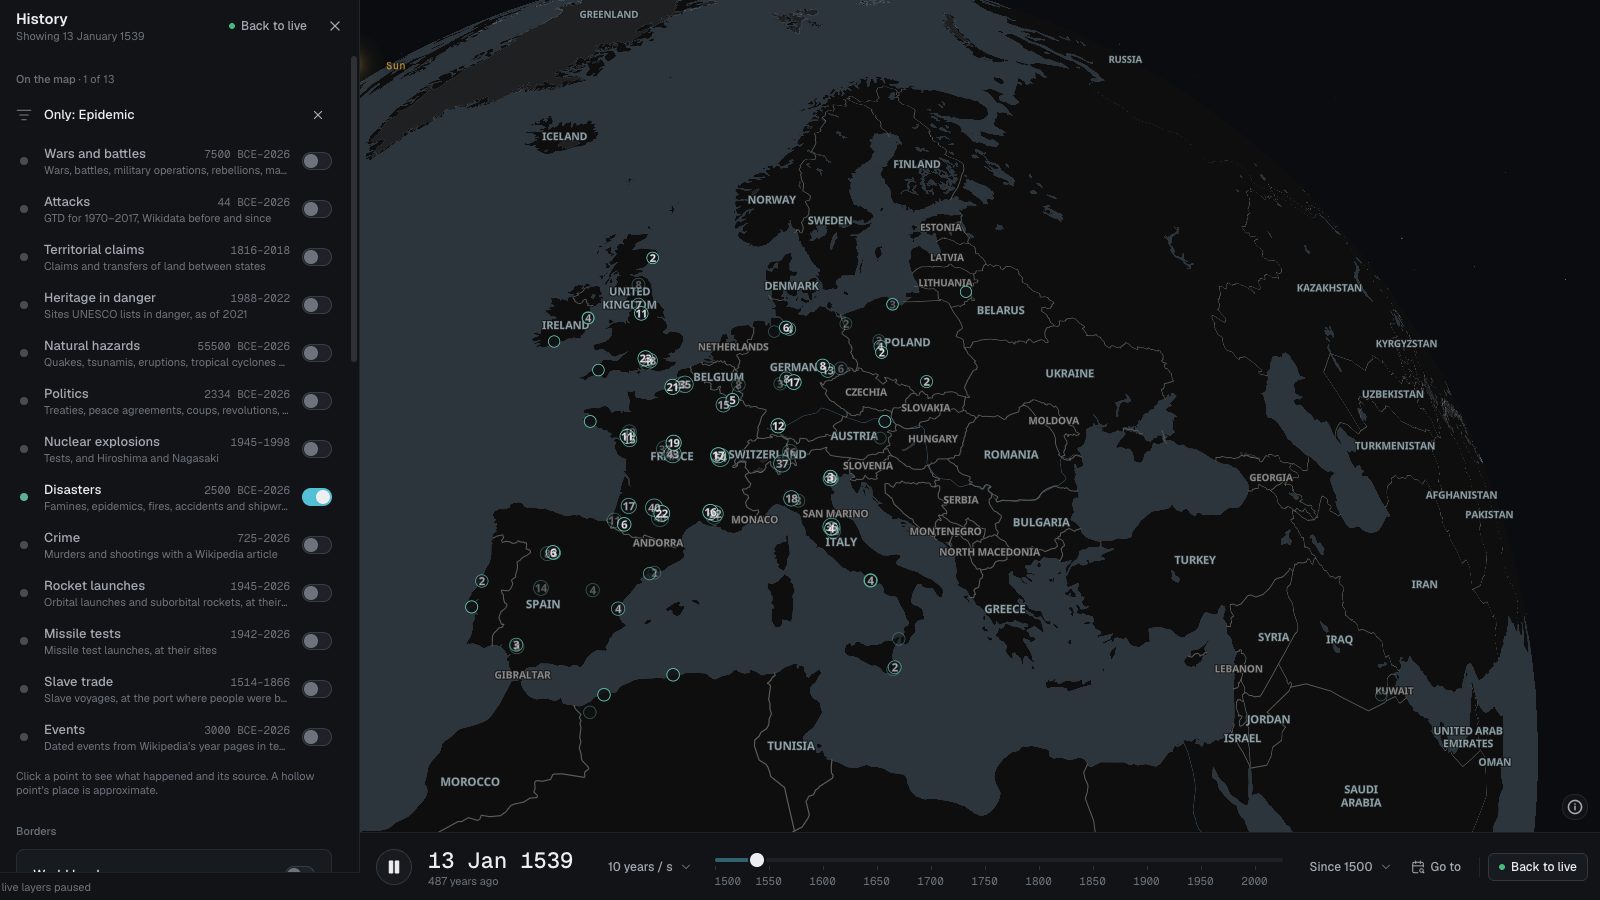 Plague and epidemicsAbout 6,800 plague outbreaks in European towns from 1347 to 1900, from Biraben’s list, and about 400 epidemics from Wikidata, from 430 BCE to today.
 Fires and wildfiresAbout 2,000 city fires, building fires and wildfires recorded in Wikidata, from the Great Fire of Rome in 64 CE to this year’s, each placed where it burned.
 Accidents: roads, mines, explosions and crowdsAbout 1,250 road crashes, explosions, mining disasters, industrial accidents and crowd crushes recorded in Wikidata, each where it happened, with the deaths.