On the map
Everything on the map
Each layer is a stream of public data drawn where it happens. Switch on as many as you like and they share one map. Here is each one, with where its data comes from and what it can and can’t tell you.
 LiveOpen the live map
In the air
Aircraft from ADS-B receivers, airports and the airspace around them.
Live flight trackerSee the aircraft in the sky right now on a free live map, from ADS-B: airliners, private jets and military flights, with altitude, speed and route. Military aircraft, liveMilitary aircraft that broadcast ADS-B, live on a map: tankers, transports, patrol and surveillance flights, with type, altitude and speed where known.
 Private jets, liveBusiness jets and private aircraft on a free live map, from ADS-B: where they are, how high and how fast, with type and registration where known.
 US airport delaysLive FAA airport status on a map: ground stops, ground delay programmes and arrival and departure delays at US airports, checked every few minutes.
 Airport weather (METAR)Live airport weather from METAR reports worldwide, coloured by flight category (VFR, MVFR, IFR, LIFR), with wind, visibility, ceiling and temperature.
 Hazard airspace (SIGMETs)International SIGMETs live on a map: airspace with severe turbulence, icing, thunderstorms or volcanic ash, with flight levels, movement and valid times.
 GPS jamming and interferenceWhere aircraft are reporting degraded GPS right now, worked out from their own ADS-B broadcasts: a live map of likely GNSS jamming and spoofing.
At sea
Ships from AIS, and the straits and canals they squeeze through.
 Live ship trackerShips at sea right now on a free live map, from AIS: cargo ships, tankers, ferries, fishing boats and warships, with speed, heading and destination.
 Shipping chokepointsTraffic through the world’s shipping chokepoints from IMF PortWatch: daily transits through Hormuz, Suez, Bab el-Mandeb, Malacca and more, against normal.
In space
Satellites, the ISS, rocket launches and the aurora.
 Satellite trackerAbout 18,000 satellites and pieces of debris on a live 3D globe, placed from CelesTrak orbital data: see what is overhead, its orbit and its next passes.
 Where is the ISS now?Follow the International Space Station live on a map: where it is now, its orbit, how high and fast it is going, and when it next passes over you.
 Starlink satellites, liveStarlink and other communications satellites on a live 3D globe, placed from CelesTrak orbital data: thousands of them, moving in real time.
 Military satellitesMilitary, reconnaissance and early-warning satellites whose orbits are public, on a live 3D globe from CelesTrak data, with orbit, altitude and passes.
 Navigation satellitesNavigation satellites on a live 3D globe: GPS, Galileo, GLONASS and BeiDou, placed from CelesTrak orbital data, with orbit, altitude and next passes.
 Upcoming rocket launchesUpcoming rocket launches worldwide on a map, from Launch Library 2: the next launch from each pad, with rocket, mission, time and live webcasts.
 Aurora forecastNOAA’s aurora forecast live on a map: where the northern and southern lights are likely in the next half hour, over the line between day and night.
 The Sun, Moon and planetsThe Sun, Moon, planets and brightest stars in their true places around a live 3D globe, from NASA JPL Horizons and the Yale Bright Star Catalogue.
 Day and night, liveA live world map of day and night: the line between them moving with the Sun, so you can see where it is daytime, dusk or night anywhere on Earth.
 The solar system, live in 3DThe solar system in real-time 3D: the planets where they are now, about 150 spacecraft, dwarf planets, interstellar objects and 8,300 distant minor planets.
 Spacecraft across the solar systemAbout 150 spacecraft placed live by NASA JPL Horizons, from Voyager 1 and 2 to the James Webb telescope, with their distance, light time and flight replays.
 The Moon in 3DThe Moon as a 3D globe from NASA’s Lunar Reconnaissance Orbiter, with landing sites, the paths the rovers drove and the orbiters circling it now.
 Mars in 3DMars as a 3D globe from Viking imagery, with the landing sites, the paths the rovers have driven, and the orbiters circling the planet right now.
 The Sun, liveThe latest image of the Sun from NASA’s Solar Dynamics Observatory, in extreme ultraviolet, on a 3D globe in TAKIP’s live view of the solar system.
 From the stars to the edge of the universeFly from the Sun to the edge of the observable universe: 12,807 nearby stars, planets around other stars, the Milky Way and 43,463 galaxies, all in 3D.
Weather
Radar, wind, temperature, lightning and the Earth from weather satellites.
 Rain radarLive weather radar on a map, from RainViewer: rain and snow seen by ground radars worldwide over the last two hours, looping to show where it is heading.
 Wind mapA global wind map from NOAA’s GFS model: wind 10 metres up, drawn as moving streaks, with speed and direction anywhere in the world.
 Temperature mapAir temperature 2 metres above the ground worldwide, from NOAA’s GFS model at 0.25°, on a live map with readings labelled across it in °C or °F.
 LightningLightning strike density from NOAA nowCOAST on a live map: thunderstorms across the Americas and the Pacific, in 15-minute frames that follow Replay.
 Earth from weather satellites, liveThe whole Earth from GOES, Meteosat and Himawari weather satellites on a live map, a new frame every 10 minutes, about 40 minutes behind real time.
 Live cloudsGlobal cloud cover from NOAA’s mosaic of weather satellites, refreshed hourly and drawn in 3D over the map, so you can see where the skies are clear.
 Daily satellite imagesNASA’s daily true-colour images of the whole Earth from VIIRS and MODIS, back to February 2000, on a map that follows History and Replay to any day.
Hazards
Earthquakes, wildfires, storms, radiation and disease outbreaks.
 Earthquakes, liveEvery earthquake of magnitude 2.5 or more in the last 24 hours, worldwide, from USGS and EMSC on one live map, with magnitude, depth and place.
 Active firesActive fires worldwide from NASA FIRMS satellite hotspots in the last 24 hours, with US fire perimeters and Canadian incidents, on a live map.
 Severe weather alertsSevere weather warnings on a live map: US and Canadian alerts, WMO and GDACS warnings, NASA EONET events and hurricane forecasts, all in one place.
 Hurricanes and tropical stormsHurricanes and tropical storms on a live map, with US National Hurricane Center forecast cones and points, plus tropical cyclone alerts worldwide.
 Radiation levelsBackground radiation on a live map, from EPA RadNet monitors in the US and Safecast’s volunteer sensors worldwide, compared with each station’s normal.
 Disease outbreaksDisease outbreaks reported by the WHO, US CDC travel notices and ECDC, pinned to the country they concern, from the last 90 days, on a live map.
Cameras and streams
Public cameras and live news streams, pinned where they are.
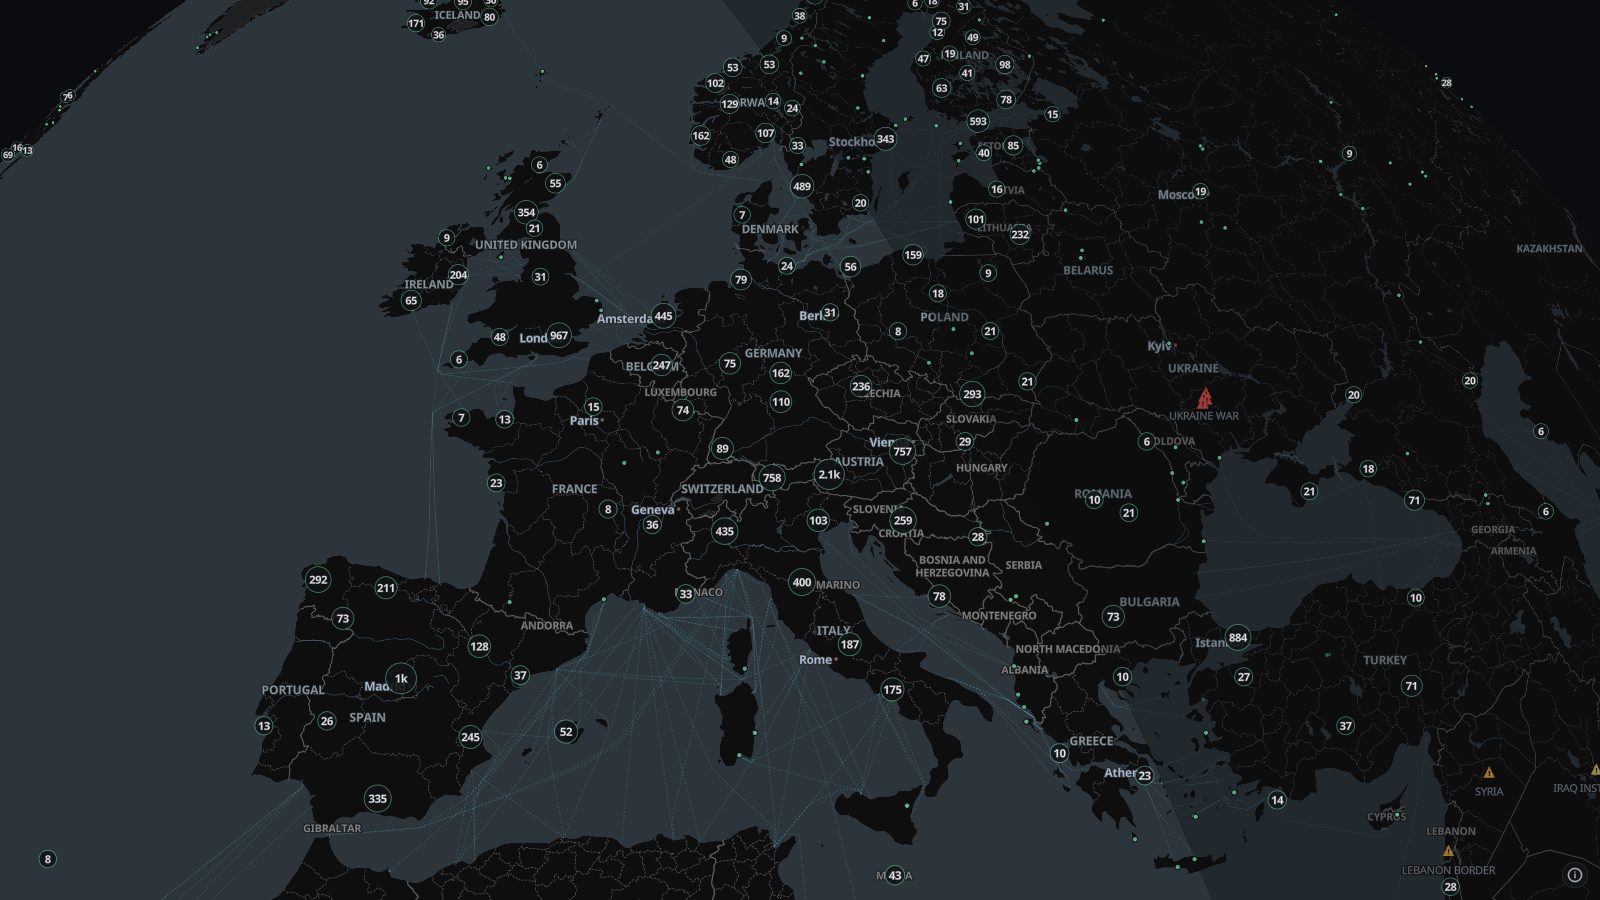 Live camerasAbout 100,000 public traffic and city cameras on one live map, from road authorities, cities and webcam networks in dozens of countries. Click to watch.
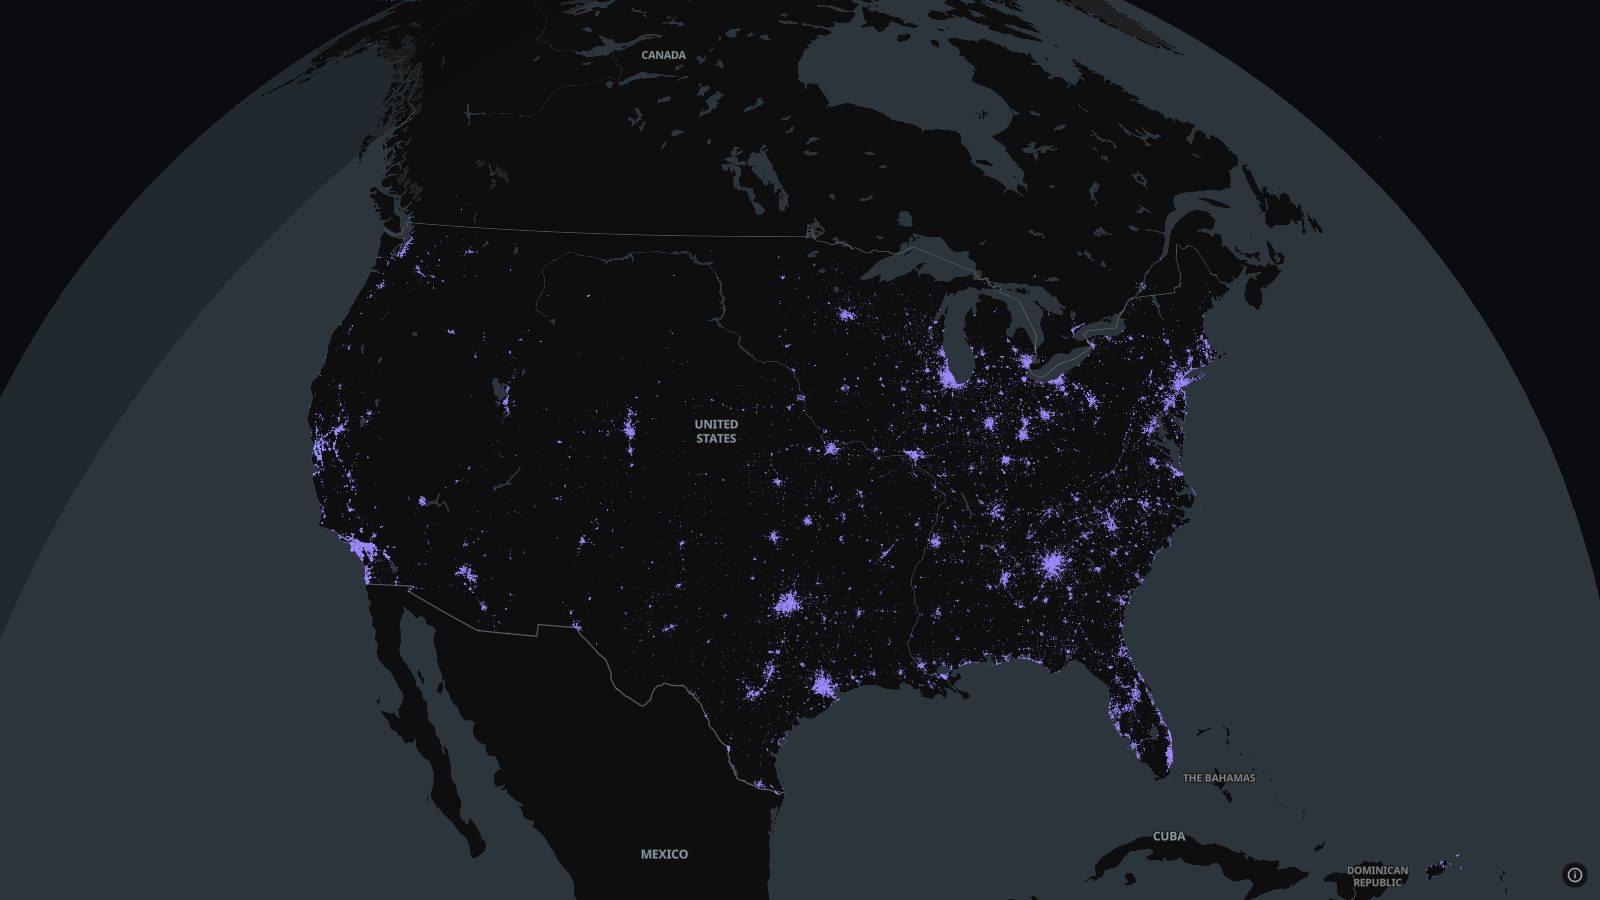 Licence-plate readers (ALPR)Automated licence-plate readers, Flock and others, mapped by volunteers on OpenStreetMap through DeFlock across the US and Canada, with where each one points.
 Live news streamsLive news channels from around the world, pinned to their newsrooms on a map: open a stream and watch it while you follow events on the same map.
On the ground
Road traffic, buses and trains, and trails.
 Buses and trains, liveBuses, trams, trains and metros moving in real time in hundreds of cities, from about 750 open transit feeds, with the route and status of each vehicle.
 Hiking routesWaymarked hiking routes worldwide from OpenStreetMap: international and national trails at every zoom, and regional and local paths as you zoom in.
World events
News as it is reported, air-raid alerts and the places that matter in a crisis.
 World news on the mapBreaking news placed on a live map: reports from news wires and public Telegram channels pinned to the places they name, beside GDELT’s coded events.
 Air-raid alertsAir-raid alerts as they sound, on a live map: Ukraine’s regional alerts and Israel’s rocket sirens, with when each began and how many in the last day.
 Disaster alertsEarthquakes, tropical cyclones, floods, volcanoes and droughts flagged by GDACS, the UN and EU global disaster alert system, on a live map.
The internet
Outages, attacks, malware and the cables that carry it all.
 Internet outagesInternet outages around the world from Cloudflare Radar, on a live map: which countries and networks lost connectivity, why, and for how long.
 Attack originsThe countries most network-layer DDoS attack traffic comes from, per Cloudflare Radar over the last day, on a live map with each country’s share.
 Malware and botnetsMalware download sites from abuse.ch URLhaus as they are reported, and active botnet command servers from Feodo Tracker, on a live map.
 Service incidentsIncidents posted on the status pages of major cloud and software services, on a live map: what is down or degraded right now, in their own words.
 Undersea cablesThe undersea cables that carry the internet between continents, on a map with where each one lands, under live ships, outages and more.
Back in time
Replay recorded traffic, travel through history, and watch the continents drift.
 The world through historyAn interactive historical atlas: the world’s borders year by year from 3400 BCE, with wars, battles and other events from 7500 BCE, on a 3D globe.
 The world in 1914The world in 1914 on an interactive map: the empires and borders on the eve of the First World War, then the war’s battles as they happened.
 World War II in EuropeEurope in the Second World War on an interactive map: borders, alliances and occupation month by month from February 1938 to May 1945, with the battles.
 The Roman EmpireThe Roman Empire on an interactive historical map: its borders in 117 CE at their greatest extent, and how they grew and fell over the centuries.
 The Ottoman EmpireThe Ottoman Empire on an interactive historical map, from its rise around 1300 to its end in 1922, with its borders at the siege of Vienna in 1683.
 Countries through timeCountries coloured by life expectancy, GDP per person, population and about 45 other measures, year by year, with projections to 2100 where they exist.
 Continental driftWatch the continents move on a 3D globe, from the supercontinent Nuna 1.8 billion years ago through Pangaea to today, with a 13-chapter story along the way.
 Earth in the age of dinosaursThe continents as the dinosaurs knew them, on a 3D globe: Pangaea splitting in the Jurassic, the Atlantic opening, and the world 66 million years ago.
 Replay recorded flights and shipsPlay back the flights and ships TAKIP has recorded, on a map with a timeline: go to any moment, speed it up to a year a second, and watch it unfold again.
Tools
Draw areas, plan routes, look things up and ask TI about what is on the map.
 AreasDraw a shape on the live map and list the aircraft, ships, cameras and events inside it, export them as CSV or GeoJSON, and log what comes and goes.
 Route plannerPlan a route by car, bike or on foot on the live map, with stops along the way, things to avoid, an elevation profile and turn-by-turn directions.
 TI, the map assistantAsk TI about what is on the map, aircraft, ships, weather, quakes and news nearby. It finds, follows and explains, and draws forecasts, using your own AI key.
 ReconLook up an IP address, a domain or a username beside the live map: WHOIS, certificates, open ports, Shodan, breach records and threat lists, about 20 tools.
 ArcGIS layersSearch ArcGIS Online or paste a FeatureServer address and draw that layer on TAKIP’s live map, beside the flights, ships, weather and everything else.
 AlertsOne live feed of news from wires and public channels, earthquakes and official warnings, each a click from its place on the map, with an AI overview on Pro.